Find Your Textile Needs
In Global Textile Business China is the largest exporter and producer of textile and apparel garment country in the world. As per trade data of world bank top 5 global textile business exporter countries are China with USD $ 263353.18 M (in Million) estimate export market Share (33.69%), Germany USD $ 263353.18 M (in Million) Exports Sector Contribution (33.69%), Italy USD $ 36662.55 M (in Million) Exports Share (4.69%), India USD $ 36544.45 M (in Million) Exports Market Percentage (4.67%), Vietnam USD $ 31779.09 M (in Million) Exports Contribution (4.06%).
• World's Top 10 Textile and Clothing Importer CountriesIn Worldwide Textile and Clothing Business segment USA is the leading import country and Germany is second largest importer in the world follow by Japan, UK, China. Top 5 importers of textile products worldwide are as follow USA around USD $ 119482.18 M (in Million) with import share (16.55%), Germany around USD $ 55827.97 M (in Million) with import share (7.73%), Japan around USD $ 37749.46 M (in Million) with import share (5.23%), UK around USD $ 32842.99 M (in Million) with import share (4.55%), China around USD $ 31737.92 M (in Million) with import share (4.4%).
• Global Textile Business exports trade data in value by countryHere we Textile Infomedia provide all recent global textile business exports trade data values with country names, Export trading values, export share percentage, AHS Specific Duty Imports (Effectively Applied Rate), tariff dutiable and duty free import value and details of each country. It can help to find worldwide textile market export size and capital of global textile market export statics by country.
• Textile and Garment Importing Trade Data Value By CountrywiseWorldwide textile and clothing import trade value and statistics by country Check here all recent worldwide textile and garment import trade value, Import share percentage, Most Favored Nation (MFN) Duty imports, MFN tariff Specific Duty, Normal non discriminatory tariff import by country names. You can easily acquire the trade data of leading textile importers from textile infomedia.
In Today's world , Textile industry is flourishing and expanding at high speed technology. The textile or Garment industry's main goal is modern stylish design and production of Fibre, Yarn, Fabrics, Garment, Apparel and their supply and distribution. Here we listed some famous and reputed textile business companies from all over world. You can sort them by countries and get data access of global textile industry. Apparel and garment sector has large numbers of suppliers from China, USA, UK, UAE, South Africa, Canada and other Asian countries. Fibre raw material suppliers and exporters from global textile industry, yarn manufacturers, garment retailers and wholesalers, textile machinery traders and etc. Textile infomedia is one and only portal where you can get all leading textile mills across the globe. Register now your business and get access to world class global textile industry portal.
| Sr No | Country Name | Export Value (in Million $) | Exporter Share Percentage (%) |
|---|---|---|---|
| 1 | China | 263353.18 | 33.69 |
| 2 | Germany | 39683.57 | 5.08 |
| 3 | Italy | 36662.55 | 4.69 |
| 4 | India | 36544.45 | 4.67 |
| 5 | Vietnam | 31779.09 | 4.06 |
| 6 | Bangladesh | 28313.7 | 3.62 |
| 7 | Turkey | 27830.5 | 3.56 |
| 8 | USA | 27182.39 | 3.48 |
| 9 | Hong Kong | 20408.65 | 2.61 |
| 10 | Spain | 19392.4 | 2.48 |
| • Textile Industry export list of all country wise in the world | |||
| Total Textile Export Market Size Worldwide : | USD $ 781.8 (in Billion) | ||
| Sr No | Country Name | Import Value (in Million $) | Import Share Percentage (%) |
|---|---|---|---|
| 1 | USA | 119482.18 | 16.55 |
| 2 | Germany | 55827.97 | 7.73 |
| 3 | Japan | 37749.46 | 5.23 |
| 4 | UK | 32842.99 | 4.55 |
| 5 | China | 31737.92 | 4.4 |
| 6 | France | 31671.38 | 4.39 |
| 7 | Italy | 27084.88 | 3.75 |
| 8 | Spain | 24366.64 | 3.38 |
| 9 | Hong Kong | 18818.48 | 2.61 |
| 10 | Netherlands | 18649.16 | 2.58 |
| • Textile Industry import list of all country wise in the world | |||
| Total Textile Import Market Size Worldwide : | USD $ 721.8 (in Billion) | ||
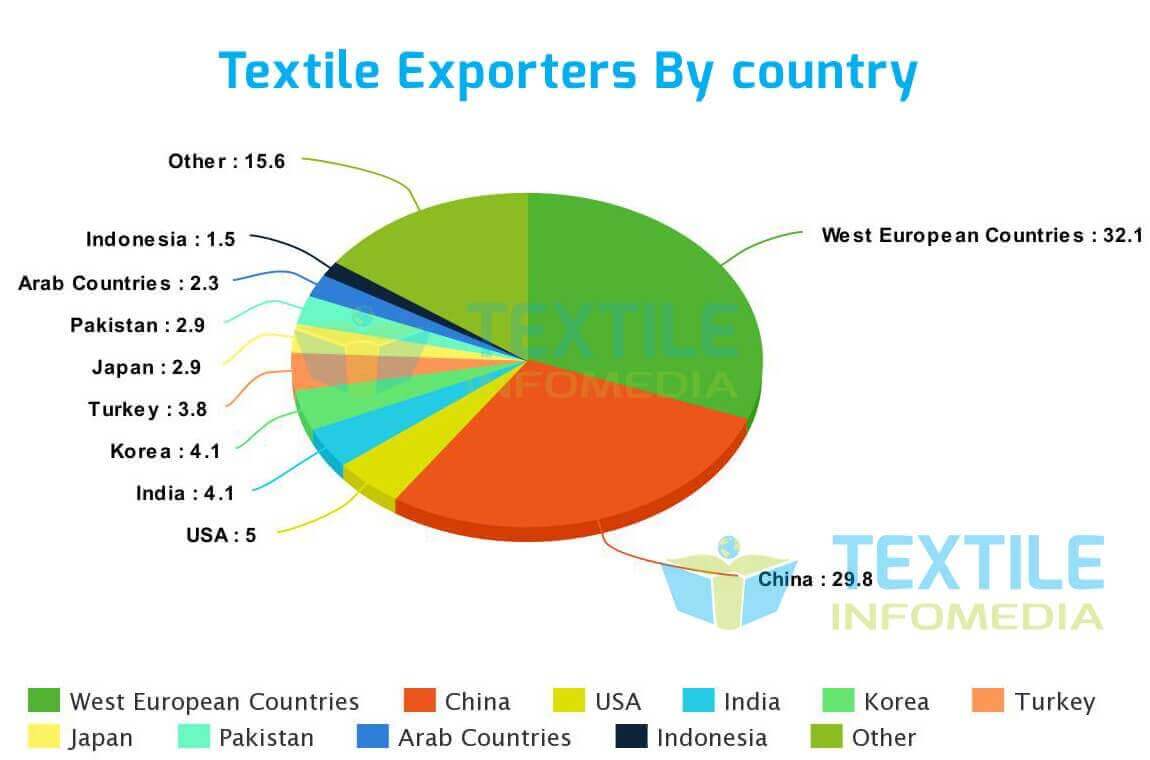
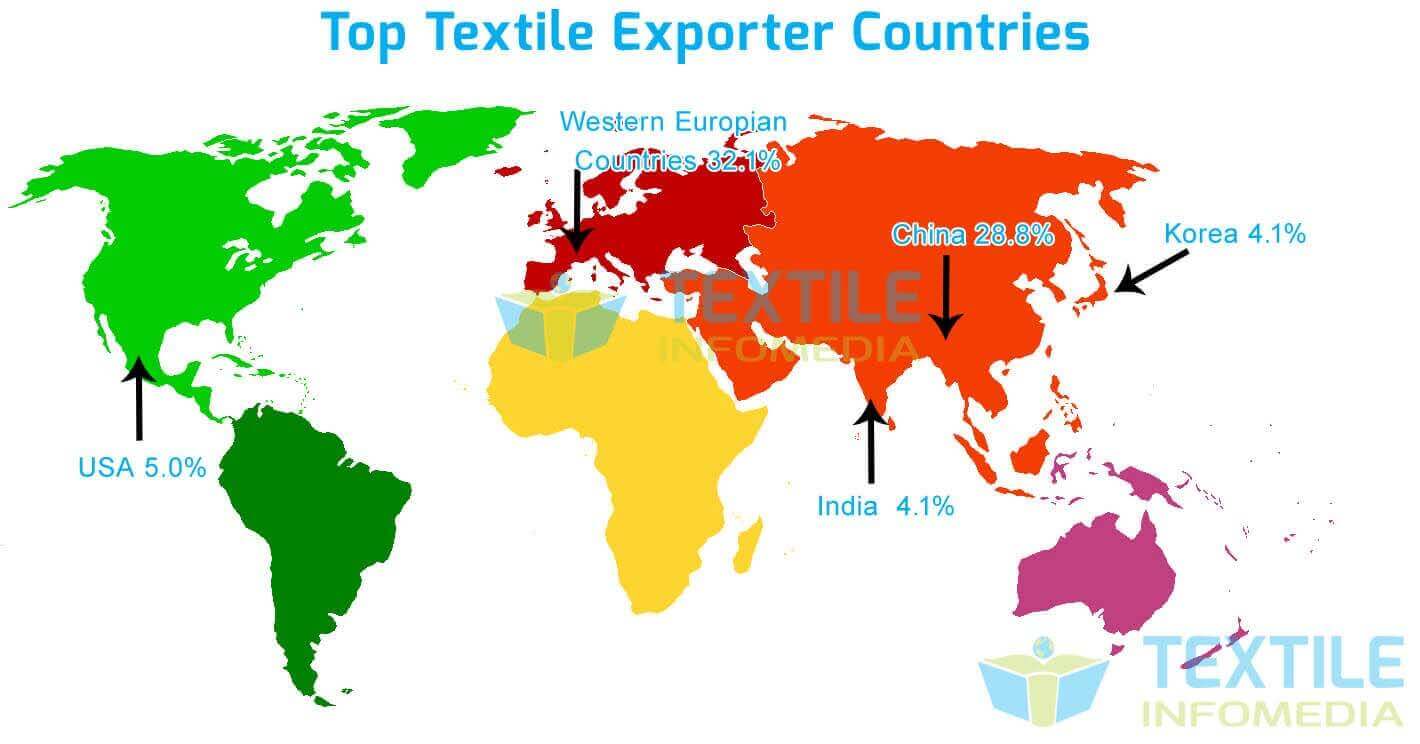
As Per Global Report, China is the Top largest textile apparel producing and exporting nation in the globe and Chinese textile industry has become Leading exporter in the world. France, Italy, Netherlands, Spain, and Germany have thousand plus textile clothing industry and its total 32.1 % contribution in textile exporter market in the world. Indian textile industry is growing and expanding since last 5 years share of Indian textile sector is around 4.1% and it is increasing day by day.
| Top Exporter | Country or Region | Textile Export Contribution |
|---|---|---|
| #1 | West European Countries | 32.1% |
| #2 | China | 29.8% |
| #3 | United State of America (USA) | 5.0% |
| #4 | India | 4.1 % |
| #5 | Korea | 4.1% |
| #6 | Turkey | 3.8% |
| #7 | Japan | 2.9% |
| #8 | Pakistan | 2.9% |
| #9 | Arab Countries | 2.3% |
| #10 | Indonesia | 1.5% |
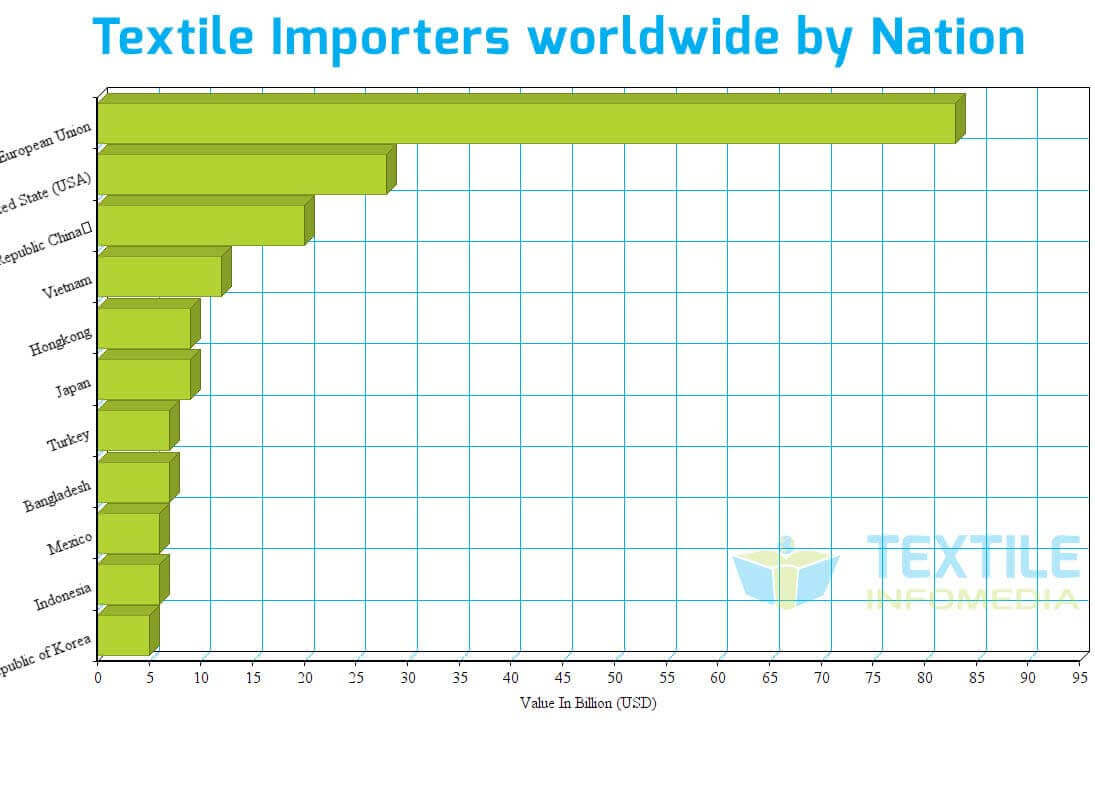
Below statistic shows that United States (USA) was the second ranked global textile importer mainly in Apparel cloth goods, textile raw Material yarn and manmade fibre depend on major south Asian and African countries.
| Top Exporter | Name of Nation | Value In Billion (USD) |
|---|---|---|
| #1 | European Union | 83 |
| #2 | United State (USA) | 28 |
| #3 | Republic China | 20 |
| #4 | Vietnam | 12 |
| #5 | Hongkong | 9 |
| #6 | Japan | 9 |
| #7 | Turkey | 7 |
| #8 | Bangladesh | 7 |
| #9 | Mexico | 6 |
| #10 | Indonesia | 6 |
| #11 | Republic of Korea | 5 |
Global Industry Analysts has stated that the global textile market for apparel, cloth and home furnishing products reached at 2000 billion USD and demand is rising day by day.
| Textile Market Sector | Valued in USD |
|---|---|
| Womenswear Industry | 622 billion |
| Mens Apparel Cloth Industry | 401.9 billion |
| Home Textile Goods Market | 339.4 billion |
| Kids and Fashion Wear Retail | 186 billion |
| Sports Footwear | 91 billion |
| Bridal Wear Industry | 57 billion |
| Retail Consumer Market | 331 billion |
The Textile industry structure is manipulated across the value chain
First Cotton, Silk, Wool Raw Material to Fibre
Spinning, Ginning and processing unit
Fabrics Weaving, Knitting and Processing
Dyeing, Bleaching, Printing and Finishing
Garment and Textile Cloth Market

In today's era textile is the second sector of providing largest employment after the agriculture sector in most of the all developing and under developing countries.
In case of India out of the total export, textile takes part at about 16% as well as in today's date India stands at second place for largest manufacturing capacity in the world.
estimated worth of global textile & clothing industry is about the US $4395billion and currently, global trade in textiles & clothing stands around the US $360bn.
The world trade organization is predicted that the global trade of the textile will expand by 3.3% this year and it is expected that it will grow by 4% next year.the success of the global trade is is largely depend on continuing major investment in innovation and invention in textile business.
Day by day the share of technical textile in the total world exports is also gradually increasing that is the reason that it forces the textile industry to the promotion.in total world wide export of the textile the share of technical textile is at about 27%. It may be even 50% in some of the western countries while in case of India it is 11%.
Transparency market research (TMR) estimated that the global technical textile market is growing with CAGR of 3.3% from 2012.iot is also expected that in 2018, The global technical textiles market will reach a market value of US$160.38 billion from US$133.93 billion in 2012.
In today's age due to the globalization, the leading textile machine manufactures like China, Germany, Italy, Switzerland, and India is in a gigantic competition to give the machines with the best technology.
Global industry analysts, Inc.(GIA) has estimated that the global bazaar for textile machinery is to reach US$ 22.9 billion by 2017. Demand for sophisticated machines that produce high-quality clothes is drastically increasing & whatever is the technology, the purchasing decision of the investor is greatly influenced by the machines versatility, flexibility, and price offers.

From last few decades, China is leading exporter in the global textile market along with it India, Italy, Germany, Bangladesh are other leading countries. in 2013 export business of China worth of 274$ bn.whereas India's export business was worth 40$bn. But in today's date if we do a study of the india and chinas exports we come to know that the Indian export is increased by 21% as compared to 2012 where as the chineese export has growth only of 11%.
Compare to all other countries Indian and Chinese apparel markets shown robust growth whereas Bangladesh is also emerging as leading manufactures of textile in the world. From 2009 to 2013, the Chinese market registered a CAGR of 13% whereas the Indian market registered a growth of 10%.so if we see the nature of countries, per Capita spend on apparel in India is only one-third of that in China so the Indian apparel market needs less import than Chinese apparel market which increases the CAGR%.
China & India are emerging as major production hubs whereas Germany & Italy showing constant Growth in textile machine manufacturing. As the revolution in the machinery development was took place in Italy & Germany so that in global textile businesses, also Italy & Germany trades textile machinery to worldwide from a number of years whereas.China, Japan &Switzerland are also coming up with their new technologies. in 2014 Germany’s global export is with the highest revenue of 2,724 million euro Whereas the Italy export revenue is 1510 million euro. Italy’s major export revenue share came from major production hubs. Italy exports 42% of its whole production to Asian countries.
As the listed earlier textile sector is one of the largest employment providing sector With over 45 million people so that the textile sector is the largest source of employment generation in the country.
India’s technical textiles market is estimated to be worth INR 70,880 crore (USD 13 billion), and, at an estimated CAGR of 8%, is expected to reach INR 1,52,000 crore (USD 28 billion) in 2023.
| Sr No | Country Name | Export Value (in Million $) | Exporter Share Percentage (%) | AHS Specific Duty Imports (in Million $) | AHS Dutiable Imports (in Million $) | AHS Duty Free Imports (in Million $) |
|---|---|---|---|---|---|---|
| 1 | China | 263353.18 | 33.69 | 0 | 0 | 0 |
| 2 | Germany | 39683.57 | 5.08 | 0 | 0 | 0 |
| 3 | Italy | 36662.55 | 4.69 | 0 | 0 | 0 |
| 4 | India | 36544.45 | 4.67 | 0 | 0 | 0.37 |
| 5 | Vietnam | 31779.09 | 4.06 | 0 | 0 | 0 |
| 6 | Bangladesh | 28313.7 | 3.62 | 0 | 0 | 0 |
| 7 | Turkey | 27830.5 | 3.56 | 0 | 0 | 0.8 |
| 8 | USA | 27182.39 | 3.48 | 0 | 0.08 | 0 |
| 9 | Hong Kong | 20408.65 | 2.61 | 0 | 0 | 0.14 |
| 10 | Spain | 19392.4 | 2.48 | 0 | 0 | 0 |
| 11 | France | 17486.38 | 2.24 | 0 | 0 | 0 |
| 12 | Belgium | 16272.97 | 2.08 | 0 | 0 | 0 |
| 13 | Netherlands | 15417.81 | 1.97 | 0 | 0 | 0 |
| 14 | Pakistan | 13439.5 | 1.72 | 0 | 40.92 | 0 |
| 15 | Indonesia | 13196.87 | 1.69 | 0 | 0 | 0 |
| 16 | UK | 12726.62 | 1.63 | 0 | 0 | 0 |
| 17 | Poland | 10020.98 | 1.28 | 0 | 0 | 0 |
| 18 | Japan | 7777.01 | 0.99 | 0 | 0 | 0.04 |
| 19 | Thailand | 7262.1 | 0.93 | 0 | 0 | 0 |
| 20 | Mexico | 6822.15 | 0.87 | 0 | 0.05 | 0 |
| 21 | Portugal | 6788.86 | 0.87 | 0 | 0 | 0 |
| 22 | Cambodia | 6719.84 | 0.86 | 0 | 0.1 | 0 |
| 23 | Austria | 6011.31 | 0.77 | 0 | 0 | 0 |
| 24 | Denmark | 5993.32 | 0.77 | 0 | 0 | 0 |
| 25 | Czech Republic | 5509.24 | 0.7 | 0 | 0 | 0 |
| 26 | Sri Lanka | 5196.31 | 0.66 | 0 | 0.01 | 0 |
| 27 | Romania | 4788.12 | 0.61 | 0 | 0 | 0 |
| 28 | UAE | 4521.96 | 0.58 | 0 | 0 | 0 |
| 29 | Australia | 4358.52 | 0.56 | 0 | 0 | 0.11 |
| 30 | Myanmar | 4214.7 | 0.54 | 0 | 0 | 0 |
| 31 | Morocco | 3834.33 | 0.49 | 0 | 0 | 0 |
| 32 | Switzerland | 3768.25 | 0.48 | 0 | 0 | 0.43 |
| 33 | Canada | 3273.53 | 0.42 | 0 | 0 | 0 |
| 34 | Malaysia | 3245.2 | 0.42 | 0 | 0 | 0 |
| 35 | Egypt, Arab Rep. | 3172.78 | 0.41 | 0 | 0 | 0 |
| 36 | Sweden | 2763.03 | 0.35 | 0 | 0 | 0 |
| 37 | El Salvador | 2695.84 | 0.34 | 0 | 0.01 | 0 |
| 38 | Tunisia | 2591.44 | 0.33 | 0 | 0 | 0 |
| 39 | Brazil | 2557.79 | 0.33 | 0 | 0.01 | 0 |
| 40 | Bulgaria | 2378.63 | 0.3 | 0 | 0 | 0 |
| 41 | Singapore | 2245.73 | 0.29 | 0 | 0 | 0 |
| 42 | Slovakia | 1975.93 | 0.25 | 0 | 0 | 0 |
| 43 | Jordan | 1799.76 | 0.23 | 0 | 0 | 0 |
| 44 | Greece | 1669.23 | 0.21 | 0 | 0 | 0 |
| 45 | Hungary | 1660.36 | 0.21 | 0 | 0 | 0 |
| 46 | Guatemala | 1634.58 | 0.21 | 0 | 0 | 0 |
| 47 | Lithuania | 1562.46 | 0.2 | 0 | 0 | 0 |
| 48 | Uzbekistan | 1534.72 | 0.2 | 0 | 0 | 0 |
| 49 | Nicaragua | 1459.25 | 0.19 | 0 | 0 | 0 |
| 50 | Peru | 1444.61 | 0.18 | 0 | 0 | 0 |
| 51 | Panama | 1422.14 | 0.18 | 0 | 0 | 0 |
| 52 | South Africa | 1388.27 | 0.18 | 0 | 0 | 0 |
| 53 | Belarus | 1302.83 | 0.17 | 0 | 0.33 | 0 |
| 54 | Philippines | 1140.06 | 0.15 | 0 | 0 | 0 |
| 55 | Syria | 1137.35 | 0.15 | 0 | 0 | 4.86 |
| 56 | Croatia | 1025.9 | 0.13 | 0 | 0 | 0 |
| 57 | Israel | 963.05 | 0.12 | 0 | 0 | 0 |
| 58 | Russia | 949.62 | 0.12 | 0 | 0 | 0.25 |
| 59 | Dominican Republic | 914.66 | 0.12 | 0 | 0.01 | 0 |
| 60 | Slovenia | 906.1 | 0.12 | 0 | 0 | 0 |
| 61 | Iran | 901.71 | 0.12 | 0 | 0 | 0 |
| 62 | Ukraine | 846 | 0.11 | 0 | 0 | 0 |
| 63 | New Zealand | 770.14 | 0.1 | 0 | 0 | 0 |
| 64 | Colombia | 739.54 | 0.09 | 0 | 0 | 0 |
| 65 | Mauritius | 726.36 | 0.09 | 0 | 0 | 0 |
| 66 | Finland | 660.21 | 0.08 | 0 | 0 | 0 |
| 67 | Luxembourg | 652.02 | 0.08 | 0 | 0 | 0 |
| 68 | Chile | 638.22 | 0.08 | 0 | 0 | 0 |
| 69 | Ireland | 623 | 0.08 | 0 | 0 | 0 |
| 70 | Albania | 582.95 | 0.07 | 0 | 0 | 0 |
| 71 | Argentina | 547.75 | 0.07 | 0 | 0 | 0 |
| 72 | Madagascar | 544.7 | 0.07 | 0 | 0 | 0 |
| 73 | Lesotho | 524.32 | 0.07 | 0 | 0 | 0 |
| 74 | Saudi Arabia | 497.4 | 0.06 | 0 | 0 | 0 |
| 75 | Estonia | 476.1 | 0.06 | 0 | 0 | 0 |
| 76 | Benin | 462.18 | 0.06 | 0 | 0 | 0 |
| 77 | Kenya | 423.17 | 0.05 | 0 | 0 | 0 |
| 78 | Mongolia | 409.62 | 0.05 | 0 | 0.09 | 0 |
| 79 | Latvia | 406.18 | 0.05 | 0 | 0 | 0 |
| 80 | Bosnia and Herzegovina | 378.89 | 0.05 | 0 | 0 | 0 |
| 81 | Moldova | 368.93 | 0.05 | 0 | 0 | 0 |
| 82 | Cote d ivoire | 364.39 | 0.05 | 0 | 0 | 0 |
| 83 | Turkmenistan | 360.83 | 0.05 | 0 | 0 | 0 |
| 84 | Afghanistan | 344.72 | 0.04 | 0 | 0 | 0 |
| 85 | Cameroon | 340.71 | 0.04 | 0 | 0 | 0 |
| 86 | Nepal | 327.08 | 0.04 | 0 | 0 | 0 |
| 87 | Burkina Faso | 325.48 | 0.04 | 0 | 0 | 0 |
| 88 | Uruguay | 275.69 | 0.04 | 0 | 0 | 0 |
| 89 | Norway | 271.1 | 0.03 | 0 | 0 | 0.13 |
| 90 | Armenia | 225.16 | 0.03 | 0 | 0 | 0 |
| 91 | Bahrain | 224.04 | 0.03 | 0 | 0 | 0 |
| 92 | Kyrgyzstan | 192.7 | 0.02 | 0 | 0 | 0 |
| 93 | Paraguay | 192.18 | 0.02 | 0 | 0.02 | 0 |
| 94 | Kazakhstan | 181.61 | 0.02 | 0 | 0 | 0.1 |
| 95 | Mali | 137.72 | 0.02 | 0 | 0 | 0 |
| 96 | Azerbaijan | 135.1 | 0.02 | 0 | 0 | 0 |
| 97 | Sudan | 130.03 | 0.02 | 0 | 0.44 | 0 |
| 98 | Costa Rica | 121.88 | 0.02 | 0 | 0 | 0 |
| 99 | Oman | 107.76 | 0.01 | 0 | 0.09 | 0 |
| 100 | Georgia | 99.87 | 0.01 | 0 | 0 | 0 |
| 101 | Ecuador | 97.21 | 0.01 | 0 | 0.04 | 0 |
| 102 | Zimbabwe | 93.86 | 0.01 | 0 | 0 | 0 |
| 103 | Ethiopia(excludes Eritrea) | 92.85 | 0.01 | 0 | 0 | 0 |
| 104 | Togo | 91.16 | 0.01 | 0 | 0 | 0 |
| 105 | Uganda | 66.61 | 0.01 | 0 | 0 | 0 |
| 106 | Kuwait | 59.44 | 0.01 | 0 | 0 | 0 |
| 107 | Qatar | 54.55 | 0.01 | 0 | 0 | 0 |
| 108 | Senegal | 53.89 | 0.01 | 0 | 0 | 0 |
| 109 | Fiji | 53.24 | 0.01 | 0 | 0 | 0 |
| 110 | Zambia | 52.89 | 0.01 | 0 | 0.07 | 0 |
| 111 | Malta | 51.6 | 0.01 | 0 | 0 | 0 |
| 112 | Lebanon | 47.57 | 0.01 | 0 | 0.01 | 0 |
| 113 | Ghana | 39.92 | 0.01 | 0 | 0 | 0 |
| 114 | Niger | 38.95 | 0 | 0 | 0 | 0 |
| 115 | Tajikistan | 29.55 | 0 | 0 | 0 | 0 |
| 116 | Tanzania | 24.47 | 0 | 0 | 0 | 0 |
| 117 | Botswana | 22.86 | 0 | 0 | 0 | 0 |
| 118 | Bolivia | 22.78 | 0 | 0 | 0 | 0 |
| 119 | Honduras | 20.4 | 0 | 0 | 0 | 0 |
| 120 | Mozambique | 14.59 | 0 | 0 | 0 | 0 |
| 121 | Cyprus | 13.48 | 0 | 0 | 0 | 0 |
| 122 | Iceland | 12.16 | 0 | 0 | 0 | 0 |
| 123 | Nigeria | 10.98 | 0 | 0 | 0 | 0 |
| 124 | Brunei | 10.41 | 0 | 0 | 0 | 0 |
| 125 | Barbados | 9.99 | 0 | 0 | 0 | 0 |
| 126 | Malawi | 9.19 | 0 | 0 | 0 | 0 |
| 127 | Andorra | 8.74 | 0 | 0 | 0 | 0 |
| 128 | Rwanda | 6.99 | 0 | 1.1 | 9.35 | 0 |
| 129 | Trinidad | 5.89 | 0 | 0 | 0 | 0 |
| 130 | Bahamas | 5.87 | 0 | 0 | 0 | 0 |
| 131 | Sierra Leone | 5.51 | 0 | 0 | 0 | 0 |
| 132 | Namibia | 5.29 | 0 | 0.01 | 0.02 | 0 |
| 133 | Guinea | 3.93 | 0 | 0 | 0 | 0 |
| 134 | Algeria | 3.8 | 0 | 0 | 0.01 | 0 |
| 135 | Gambia, The | 3.1 | 0 | 0 | 0 | 0 |
| 136 | Jamaica | 2.83 | 0 | 0 | 0 | 0 |
| 137 | Venezuela | 2.16 | 0 | 0 | 0.01 | 0 |
| 138 | New Caledonia | 1.93 | 0 | 0 | 0 | 0 |
| 139 | Congo | 1.56 | 0 | 0 | 0 | 0 |
| 140 | Cuba | 1.51 | 0 | 0 | 0 | 0 |
| 141 | Antigua and Barbuda | 1.47 | 0 | 0 | 0 | 0 |
| 142 | Angola | 1.34 | 0 | 0 | 0 | 0 |
| 143 | Gabon | 1.09 | 0 | 0 | 0 | 0 |
| 144 | Djibouti | 1.04 | 0 | 0 | 5.99 | 0 |
| 145 | Papua | 1.02 | 0 | 0 | 0 | 0.04 |
| 146 | Netherlands Antilles | 0.98 | 0 | 0 | 0 | 0 |
| 147 | Suriname | 0.95 | 0 | 0 | 0.06 | 0 |
| 148 | Yemen | 0.92 | 0 | 0 | 0 | 2.07 |
| 149 | Bhutan | 0.89 | 0 | 0 | 0 | 0 |
| 150 | Belize | 0.8 | 0 | 0 | 0 | 0 |
| 151 | Reunion | 0.76 | 0 | 0 | 0 | 0 |
| 152 | Aruba | 0.68 | 0 | 0 | 0 | 0 |
| 153 | Libya | 0.45 | 0 | 0 | 0 | 0 |
| 154 | Guyana | 0.42 | 0 | 0 | 0 | 0 |
| 155 | French Polynesia | 0.41 | 0 | 0 | 0.01 | 0 |
| 156 | Burundi | 0.35 | 0 | 0 | 0 | 0 |
| 157 | Seychelles | 0.33 | 0 | 0 | 1.02 | 0.95 |
| 158 | Iraq | 0.22 | 0 | 0 | 0 | 0 |
| 159 | Samoa | 0.19 | 0 | 0 | 0 | 0 |
| 160 | Mauritania | 0.02 | 0 | 0 | 0 | 0 |
| 161 | Micronesia | 0.01 | 0 | 0 | 0 | 0 |
| 162 | Vanuatu | 0 | 0 | 0 | 0 | 0 |
| 163 | Maldives | 0 | 0 | 0 | 2.87 | 1.36 |
| 164 | Grenada | 0 | 0 | 0 | 0 | 0 |
| 165 | Chad | 0 | 0 | 0 | 0.02 | 0 |
| Total Textile Exporting Marketcap Global : | USD $ 781.8 (in Billion) | |||||
| Sr No | Country Name | Import Value (in Million $) | Import Share Percentage (%) | MFN SpecificDuty Imports (in Million $) | MFN Dutiable Imports (in Million $) | MFN Duty Free Imports (in Million $) |
|---|---|---|---|---|---|---|
| 1 | USA | 119482.18 | 16.55 | 0 | 0 | 0 |
| 2 | Germany | 55827.97 | 7.73 | 0 | 0 | 0 |
| 3 | Japan | 37749.46 | 5.23 | 0 | 0 | 0 |
| 4 | UK | 32842.99 | 4.55 | 0 | 0 | 0 |
| 5 | China | 31737.92 | 4.4 | 0 | 0 | 0 |
| 6 | France | 31671.38 | 4.39 | 0 | 0 | 0 |
| 7 | Italy | 27084.88 | 3.75 | 0 | 0 | 0 |
| 8 | Spain | 24366.64 | 3.38 | 0 | 0 | 0 |
| 9 | Hong Kong | 18818.48 | 2.61 | 0 | 0 | 0 |
| 10 | Netherlands | 18649.16 | 2.58 | 0 | 0 | 0 |
| 11 | Vietnam | 17967.28 | 2.49 | 0 | 0 | 0 |
| 12 | Canada | 14443.42 | 2 | 0 | 0 | 0 |
| 13 | Belgium | 13752.28 | 1.91 | 0 | 0 | 0 |
| 14 | Poland | 13497.93 | 1.87 | 0 | 0 | 0 |
| 15 | Bangladesh | 11853.12 | 1.64 | 0 | 0 | 0 |
| 16 | Russia | 11182.68 | 1.55 | 0 | 0 | 0 |
| 17 | Mexico | 10954.99 | 1.52 | 0 | 0 | 0 |
| 18 | Turkey | 10475.73 | 1.45 | 0 | 0 | 0 |
| 19 | Indonesia | 10015.83 | 1.39 | 0 | 0 | 0 |
| 20 | Australia | 9738.26 | 1.35 | 0 | 0 | 0 |
| 21 | Switzerland | 9110.2 | 1.26 | 0 | 0 | 0 |
| 22 | Austria | 9026.27 | 1.25 | 0 | 0 | 0 |
| 23 | India | 8843.02 | 1.23 | 0 | 0 | 0 |
| 24 | UAE | 7075.4 | 0.98 | 0 | 0 | 0 |
| 25 | Czech Republic | 6454.18 | 0.89 | 0 | 0 | 0 |
| 26 | Denmark | 6374.43 | 0.88 | 0 | 0 | 0 |
| 27 | Romania | 5901.56 | 0.82 | 0 | 0 | 0 |
| 28 | Sweden | 5848.18 | 0.81 | 0 | 0 | 0 |
| 29 | Brazil | 5594.08 | 0.78 | 0 | 0 | 0 |
| 30 | Portugal | 5487.25 | 0.76 | 0 | 0 | 0 |
| 31 | Thailand | 5373.49 | 0.74 | 0 | 0 | 0 |
| 32 | Saudi Arabia | 4795.24 | 0.66 | 0 | 0 | 0 |
| 33 | Chile | 4489.78 | 0.62 | 0 | 0 | 0 |
| 34 | Egypt, Arab Rep. | 4378.09 | 0.61 | 0 | 0 | 0 |
| 35 | Cambodia | 4235.56 | 0.59 | 0 | 0 | 0 |
| 36 | Malaysia | 4097.41 | 0.57 | 0 | 0 | 0 |
| 37 | Pakistan | 3782.76 | 0.52 | 0 | 0 | 0 |
| 38 | Morocco | 3680.41 | 0.51 | 0 | 0 | 0 |
| 39 | Norway | 3381.77 | 0.47 | 0 | 0 | 0 |
| 40 | Singapore | 3369.53 | 0.47 | 0 | 0 | 0 |
| 41 | South Africa | 3361.11 | 0.47 | 0 | 0 | 0 |
| 42 | Afghanistan | 3237.09 | 0.45 | 0 | 0 | 0 |
| 43 | Hungary | 3158.86 | 0.44 | 0 | 0 | 0 |
| 44 | Sri Lanka | 2989.77 | 0.41 | 0 | 0 | 0 |
| 45 | Israel | 2811.69 | 0.39 | 0 | 0 | 0 |
| 46 | Greece | 2755.93 | 0.38 | 0 | 0 | 0 |
| 47 | Ireland | 2715.76 | 0.38 | 0 | 0 | 0 |
| 48 | Slovakia | 2534.45 | 0.35 | 0 | 0 | 0 |
| 49 | Colombia | 2284.94 | 0.32 | 0 | 0 | 0 |
| 50 | Finland | 2277.02 | 0.32 | 0 | 0 | 0 |
| 51 | Philippines | 2198.49 | 0.3 | 0 | 0 | 0 |
| 52 | Bulgaria | 2185.22 | 0.3 | 0 | 0 | 0 |
| 53 | Tunisia | 2113.98 | 0.29 | 0 | 0 | 0 |
| 54 | Peru | 2051.51 | 0.28 | 0 | 0 | 0 |
| 55 | Ukraine | 2012.83 | 0.28 | 0 | 0 | 0 |
| 56 | New Zealand | 1884.42 | 0.26 | 0 | 0 | 0 |
| 57 | Croatia | 1849.35 | 0.26 | 0 | 0 | 0 |
| 58 | Myanmar | 1820.35 | 0.25 | 0 | 0 | 0 |
| 59 | El Salvador | 1757.63 | 0.24 | 0 | 0 | 0 |
| 60 | Lithuania | 1605.45 | 0.22 | 0 | 0 | 0 |
| 61 | Argentina | 1573.48 | 0.22 | 0 | 0 | 0 |
| 62 | Iran | 1570.59 | 0.22 | 0 | 0 | 0 |
| 63 | Kuwait | 1556.67 | 0.22 | 0 | 0 | 0 |
| 64 | Nicaragua | 1473.53 | 0.2 | 0 | 0 | 0 |
| 65 | Belarus | 1472.77 | 0.2 | 0 | 0 | 0 |
| 66 | Venezuela | 1353.96 | 0.19 | 0 | 0 | 0 |
| 67 | Jordan | 1346.94 | 0.19 | 0 | 0 | 0 |
| 68 | Panama | 1264.34 | 0.18 | 0 | 0 | 0 |
| 69 | Guatemala | 1259.74 | 0.17 | 0 | 0 | 0 |
| 70 | Dominican Republic | 1215.44 | 0.17 | 0 | 0 | 0 |
| 71 | Slovenia | 1200.19 | 0.17 | 0 | 0 | 0 |
| 72 | Algeria | 1148.96 | 0.16 | 0 | 0 | 0 |
| 73 | Kazakhstan | 1017.35 | 0.14 | 0 | 0 | 0 |
| 74 | Qatar | 967.16 | 0.13 | 0 | 0 | 0 |
| 75 | Kenya | 833.95 | 0.12 | 0 | 0 | 0 |
| 76 | Estonia | 804.16 | 0.11 | 0 | 0 | 0 |
| 77 | Kyrgyzstan | 781.75 | 0.11 | 0 | 0 | 0 |
| 78 | Ethiopia(excludes Eritrea) | 768.01 | 0.11 | 0 | 0 | 0 |
| 79 | Lebanon | 757.05 | 0.1 | 0 | 0 | 0 |
| 80 | Ecuador | 755.97 | 0.1 | 0 | 0 | 0 |
| 81 | Bosnia and Herzegovina | 744.96 | 0.1 | 0 | 0 | 0 |
| 82 | Luxembourg | 695.21 | 0.1 | 0 | 0 | 0 |
| 83 | Albania | 664.03 | 0.09 | 0 | 0 | 0 |
| 84 | Syria | 659.62 | 0.09 | 0 | 0 | 0 |
| 85 | Madagascar | 617.17 | 0.09 | 0 | 0 | 0 |
| 86 | Latvia | 602.01 | 0.08 | 0 | 0 | 0 |
| 87 | Sudan | 594.51 | 0.08 | 0 | 0 | 0 |
| 88 | Costa Rica | 564.03 | 0.08 | 0 | 0 | 0 |
| 89 | Nigeria | 551.07 | 0.08 | 0 | 0 | 0 |
| 90 | Uruguay | 486.52 | 0.07 | 0 | 0 | 0 |
| 91 | Oman | 483.99 | 0.07 | 0 | 0 | 0 |
| 92 | Bahrain | 472.13 | 0.07 | 0 | 0 | 0 |
| 93 | Azerbaijan | 431.04 | 0.06 | 0 | 0 | 0 |
| 94 | Moldova | 426.01 | 0.06 | 0 | 0 | 0 |
| 95 | Paraguay | 404.23 | 0.06 | 0 | 0 | 0 |
| 96 | Mauritius | 392.47 | 0.05 | 0 | 0 | 0 |
| 97 | Nepal | 391.5 | 0.05 | 0 | 0 | 0 |
| 98 | Georgia | 369.22 | 0.05 | 0 | 0 | 0 |
| 99 | Lesotho | 348.85 | 0.05 | 0 | 0 | 0 |
| 100 | Cyprus | 340.24 | 0.05 | 0 | 0 | 0 |
| 101 | Angola | 319.68 | 0.04 | 0 | 0 | 0 |
| 102 | Armenia | 317.49 | 0.04 | 0 | 0 | 0 |
| 103 | Ghana | 308.69 | 0.04 | 0 | 0 | 0 |
| 104 | Tanzania | 304.68 | 0.04 | 0 | 0 | 0 |
| 105 | Uzbekistan | 303.04 | 0.04 | 0 | 0 | 0 |
| 106 | Honduras | 301.26 | 0.04 | 0 | 0 | 0 |
| 107 | Cameroon | 299.44 | 0.04 | 0 | 0 | 0 |
| 108 | Uganda | 268.81 | 0.04 | 0 | 0 | 0 |
| 109 | Iceland | 253.82 | 0.04 | 0 | 0 | 0 |
| 110 | Libya | 244.59 | 0.03 | 0 | 0 | 0 |
| 111 | Bolivia | 221.93 | 0.03 | 0 | 0 | 0 |
| 112 | Namibia | 205.81 | 0.03 | 0 | 0 | 0 |
| 113 | Cote d ivoire | 203.3 | 0.03 | 0 | 0 | 0 |
| 114 | Cuba | 187.49 | 0.03 | 0 | 0 | 0 |
| 115 | Mozambique | 186.04 | 0.03 | 0 | 0 | 0 |
| 116 | Senegal | 175.73 | 0.02 | 0 | 0 | 0 |
| 117 | Iraq | 173.65 | 0.02 | 0 | 0 | 0 |
| 118 | Malta | 152.09 | 0.02 | 0 | 0 | 0 |
| 119 | Yemen | 148.55 | 0.02 | 0 | 0 | 0 |
| 120 | Papua | 142.66 | 0.02 | 0 | 0 | 0 |
| 121 | Zambia | 136.17 | 0.02 | 0 | 0 | 0 |
| 122 | Botswana | 132.47 | 0.02 | 0 | 0 | 0 |
| 123 | Togo | 129.55 | 0.02 | 0 | 0 | 0 |
| 124 | Andorra | 126.29 | 0.02 | 0 | 0 | 0 |
| 125 | Trinidad | 125.36 | 0.02 | 0 | 0 | 0 |
| 126 | Reunion | 123.57 | 0.02 | 0 | 0 | 0 |
| 127 | Jamaica | 122.71 | 0.02 | 0 | 0 | 0 |
| 128 | Fiji | 110.44 | 0.02 | 0 | 0 | 0 |
| 129 | Zimbabwe | 94.17 | 0.01 | 0 | 0 | 0 |
| 130 | Malawi | 91.95 | 0.01 | 0 | 0 | 0 |
| 131 | Mongolia | 90.33 | 0.01 | 0 | 0 | 0 |
| 132 | Bahamas | 88.38 | 0.01 | 0 | 0 | 0 |
| 133 | Rwanda | 87.21 | 0.01 | 0 | 0 | 0 |
| 134 | Mali | 86.05 | 0.01 | 0 | 0 | 0 |
| 135 | New Caledonia | 79.19 | 0.01 | 0 | 0 | 0 |
| 136 | Benin | 71.11 | 0.01 | 0 | 0 | 0 |
| 137 | Guinea | 70.4 | 0.01 | 0 | 0 | 0 |
| 138 | Mauritania | 67.12 | 0.01 | 0 | 0 | 0 |
| 139 | Maldives | 66.72 | 0.01 | 0 | 0 | 0 |
| 140 | Belize | 64.78 | 0.01 | 0 | 0 | 0 |
| 141 | Brunei | 59.72 | 0.01 | 0 | 0 | 0 |
| 142 | Aruba | 59.37 | 0.01 | 0 | 0 | 0 |
| 143 | Netherlands Antilles | 56.26 | 0.01 | 0 | 0 | 0 |
| 144 | Burkina Faso | 51.84 | 0.01 | 0 | 0 | 0 |
| 145 | Congo | 51.26 | 0.01 | 0 | 0 | 0 |
| 146 | Turkmenistan | 49.02 | 0.01 | 0 | 0 | 0 |
| 147 | French Polynesia | 46.91 | 0.01 | 0 | 0 | 0 |
| 148 | Barbados | 41.23 | 0.01 | 0 | 0 | 0 |
| 149 | Guyana | 40.02 | 0.01 | 0 | 0 | 0 |
| 150 | Niger | 40 | 0.01 | 0 | 0 | 0 |
| 151 | Burundi | 34.79 | 0 | 0 | 0 | 0 |
| 152 | Gabon | 31.51 | 0 | 0 | 0 | 0 |
| 153 | Sierra Leone | 29.51 | 0 | 0 | 0 | 0 |
| 154 | Suriname | 24.4 | 0 | 0 | 0 | 0 |
| 155 | Djibouti | 22.25 | 0 | 0 | 0 | 0 |
| 156 | Antigua and Barbuda | 16.64 | 0 | 0 | 0 | 0 |
| 157 | Seychelles | 16.64 | 0 | 0 | 0 | 0 |
| 158 | Bhutan | 14.68 | 0 | 0 | 0 | 0 |
| 159 | Gambia, The | 12.38 | 0 | 0 | 0 | 0 |
| 160 | Samoa | 9.62 | 0 | 0 | 0 | 0 |
| 161 | Vanuatu | 8.83 | 0 | 0 | 0 | 0 |
| 162 | Grenada | 6.32 | 0 | 0 | 0 | 0 |
| 163 | Tajikistan | 5.76 | 0 | 0 | 0 | 0 |
| 164 | Chad | 4.47 | 0 | 0 | 0 | 0 |
| 165 | Micronesia | 3.61 | 0 | 0 | 0 | 0 |
| Total Textile Importing Marketcap Global : | USD $ 721.8 (in Billion) | |||||
Elite Exchange, a customer focused company is engaged in providing the fighting sports solutions a wide range of market. . . .
La Madeleine Paris, new Slowear opening: a jewel of classical architecture, a few steps from the most famous destination . . .
Textile printing specialists since 2004. A team of professionals to help you realize your professional and personal proj . . .
Grand choix de chemises et accessoires pour homme. Chemises classiques et chemises mode cintrées. Vente de chemises 100 . . .

Is this page helpful?
Average Ratings 4.6 (96 Ratings)


copyrights © 2025 Textile Infomedia all rights reserved.
 apparel and garments
 ethnic wear
 fibre
fibre yarn
yarn fabrics
 home textile
 textile machinery
 textile mill


